Kappa
“Great things are not done by impulse, but by a series of small things brought together.”
Hack The Box
HTTP Requests and Responses
HTTP communications mainly consist of an HTTP request and an HTTP response. An HTTP request is made by the client (e.g. cURL/browser), and is processed by the server (e.g. web server). The requests contain all of the details we require from the server, including the resource (e.g. URL, path, parameters), any request data, headers or options we specify, and many other options we will discuss throughout this module.
Once the server receives the HTTP request, it processes it and responds by sending the HTTP response, which contains the response code, as discussed in a later section, and may contain the resource data if the requester has access to it.
HTTP Request
Let's start by examining the following example HTTP request:
- https://academy.hackthebox.com/storage/modules/35/raw_request.png
- http://inlanefreight.com/users/login.html
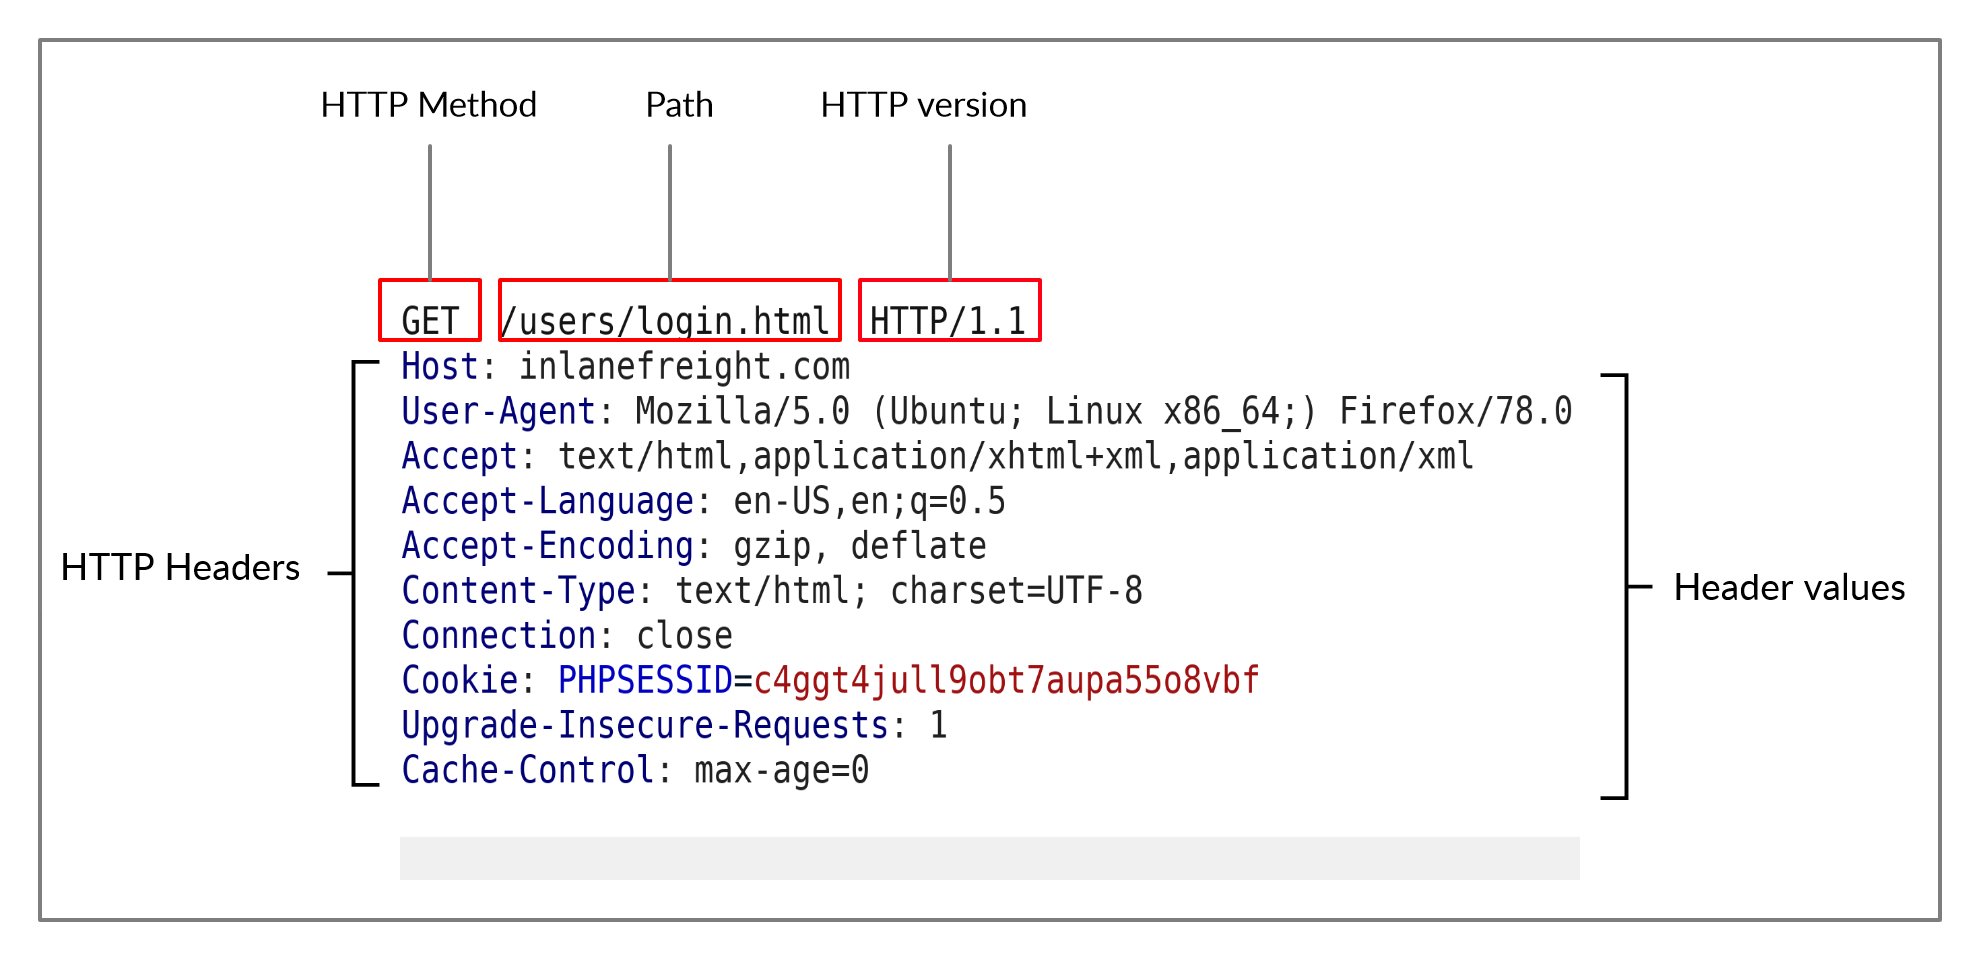
The first line of any HTTP request contains three main fields 'separated by spaces':
- Method - GET - The HTTP method or verb, which specifies the type of action to perform.
- Path - /users/login.html - The path to the resource being accessed. This field can also be suffixed with a query string (e.g. ?username=user).
- Version HTTP/1.1 - The third and final field is used to denote the HTTP version.
The next set of lines contain HTTP header value pairs, like Host, User-Agent, Cookie, and many other possible headers. These headers are used to specify various attributes of a request. The headers are terminated with a new line, which is necessary for the server to validate the request. Finally, a request may end with the request body and data.
Note: HTTP version 1.X sends requests as clear-text, and uses a new-line character to separate different fields and different requests. HTTP version 2.X, on the other hand, sends requests as binary data in a dictionary form.
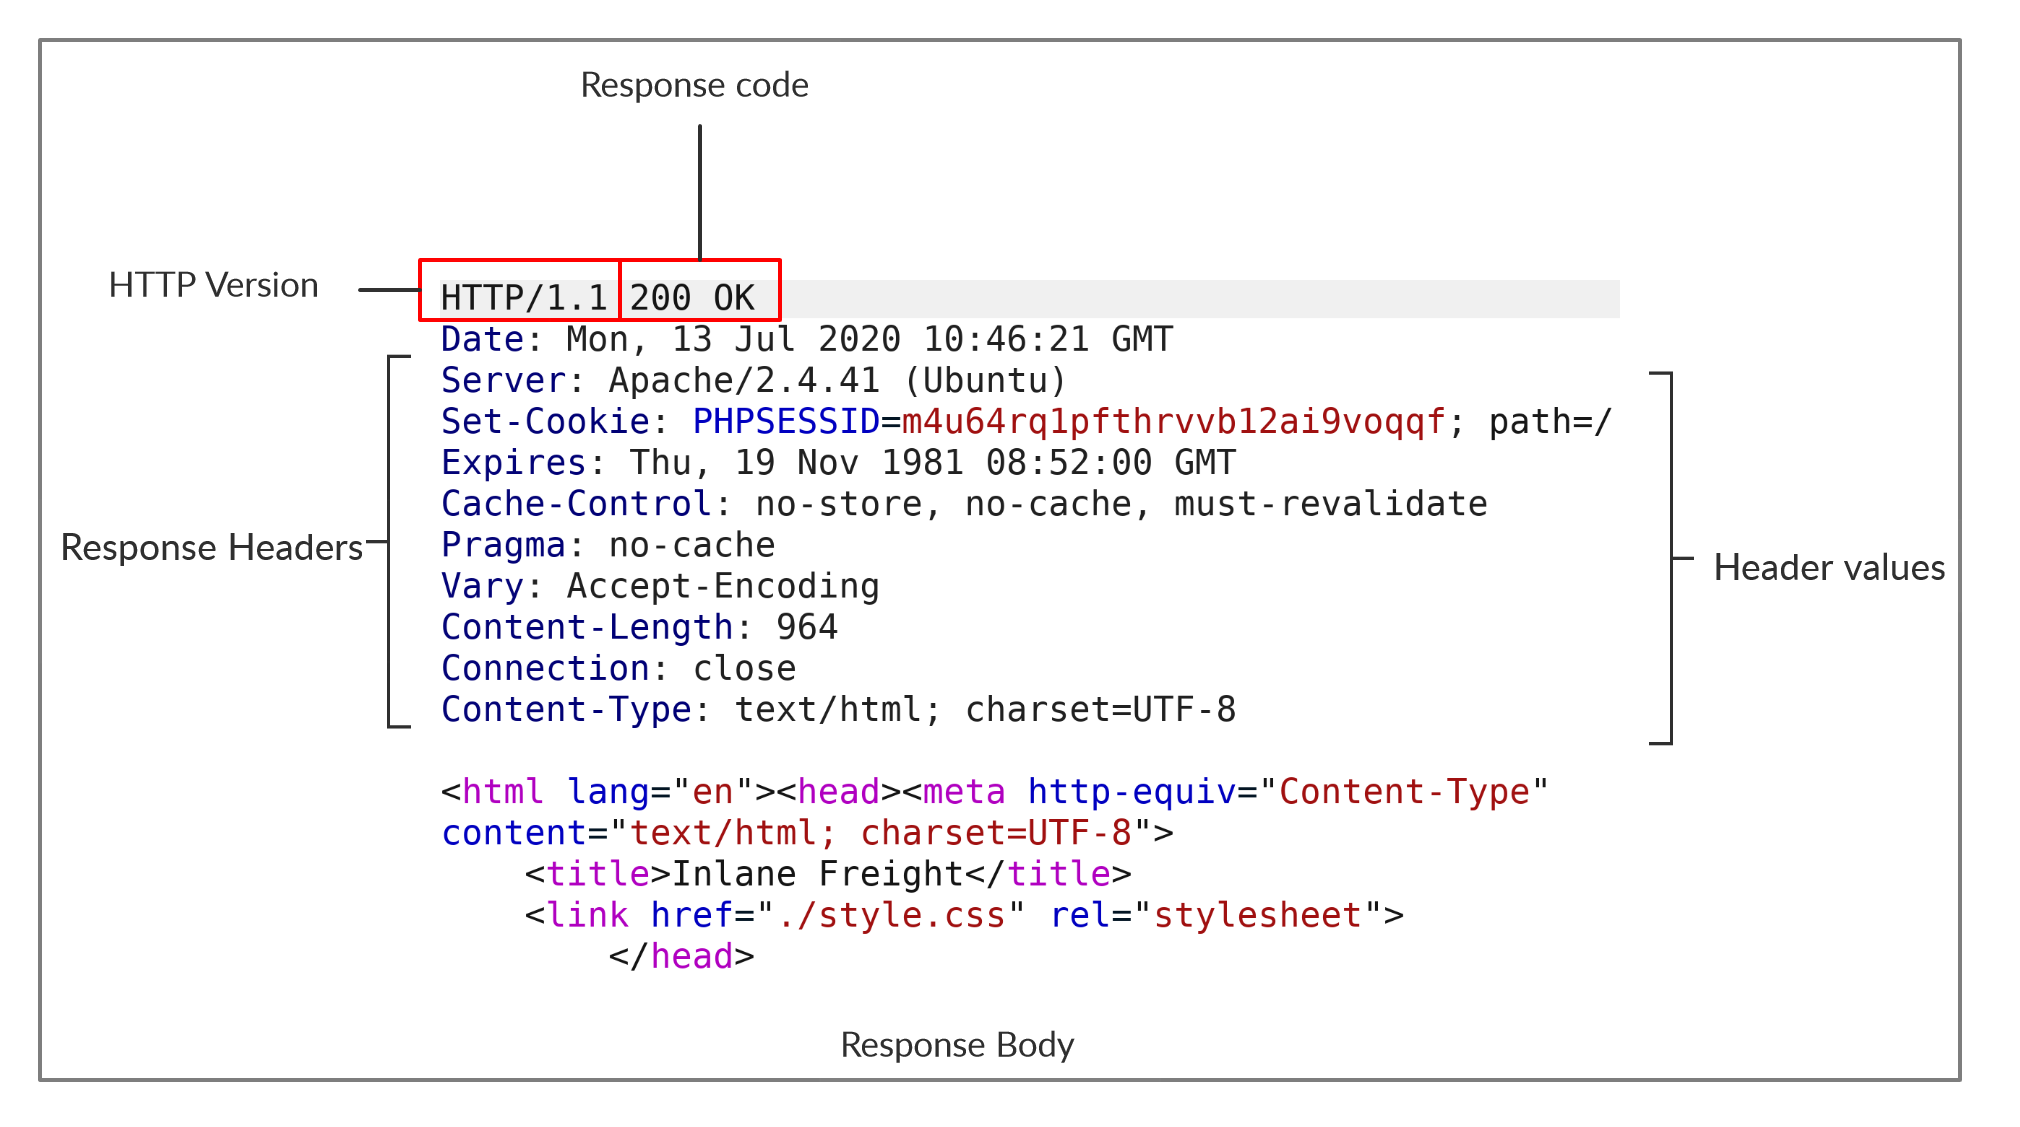
Once the server processes our request, it sends its response. The following is an example HTTP response:
The first line of an HTTP response contains two fields separated by spaces. The first being the HTTP version (e.g. HTTP/1.1), and the second denotes the HTTP response code (e.g. 200 OK).
Response codes are used to determine the request's status, as will be discussed in a later section. After the first line, the response lists its headers, similar to an HTTP request. Both request and response headers are discussed in the next section.
Finally, the response may end with a response body, which is separated by a new line after the headers. The response body is usually defined as HTML code. However, it can also respond with other code types such as JSON, website resources such as images, style sheets or scripts, or even a document such as a PDF document hosted on the webserver.
cURL
In our earlier examples with cURL, we only specified the URL and got the response body in return. However, cURL also allows us to preview the full HTTP request and the full HTTP response, which can become very handy when performing web penetration tests or writing exploits. To view the full HTTP request and response, we can simply add the -v verbose flag to our earlier commands, and it should print both the request and response:
kappajester83@htb[/htb]$ curl inlanefreight.com -v
          *   Trying SERVER_IP:80...
          * TCP_NODELAY set
          * Connected to inlanefreight.com (SERVER_IP) port 80 (#0)
          > GET / HTTP/1.1
          > Host: inlanefreight.com
          > User-Agent: curl/7.65.3
          > Accept: */*
          > Connection: close
          >
          * Mark bundle as not supporting multiuse
          < HTTP/1.1 401 Unauthorized
          < Date: Tue, 21 Jul 2020 05:20:15 GMT
          < Server: Apache/X.Y.ZZ (Ubuntu)
          < WWW-Authenticate: Basic realm="Restricted Content"
          < Content-Length: 464
          < Content-Type: text/html; charset=iso-8859-1
          <
          ...SNIP...
As we can see, this time, we get the full HTTP request and response. The request simply sent GET / HTTP/1.1 along with the Host, User-Agent and Accept headers. In return, the HTTP response contained the HTTP/1.1 401 Unauthorized, which indicates that we do not have access over the requested resource, as we will see in an upcoming section. Similar to the request, the response also contained several headers sent by the server, including Date, Content-Length, and Content-Type. Finally, the response contained the response body in HTML, which is the same one we received earlier when using cURL without the -v flag.
Exercise: The -vvv flag shows an even more verbose output. Try to use this flag to see what extra request and response details get displayed with it.
Browser DevTools
Most modern web browsers come with built-in developer tools (DevTools), which are mainly intended for developers to test their web applications. However, as web penetration testers, these tools can be a vital asset in any web assessment we perform, as a browser (and its DevTools) are among the assets we are most likely to have in every web assessment exercise. In this module, we will also discuss how to utilize some of the basic browser devtools to assess and monitor different types of web requests.
Whenever we visit any website or access any web application, our browser sends multiple web requests and handles multiple HTTP responses to render the final view we see in the browser window. To open the browser devtools in either Chrome or Firefox, we can click [CTRL+SHIFT+I] or simply click [F12]. The devtools contain multiple tabs, each of which has its own use. We will mostly be focusing on the Network tab in this module, as it is responsible for web requests.
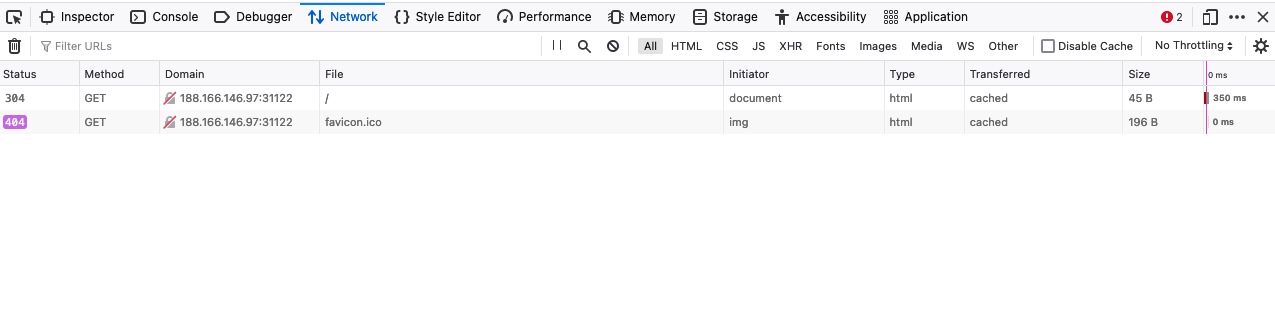
If we click on the Network tab and refresh the page, we should be able to see the list of requests sent by the page:
As we can see, the devtools show us at a glance the response status (i.e. response code), the request method used (GET), the requested resource (i.e. URL/domain), along with the requested path. Furthermore, we can use Filter URLs to search for a specific request, in case the website loads too many to go through.